Our goal is to provide a platform for exploration of the National Health and Nutrition Examination Survey (NHANES) data.
Web application
Live version here: https://bcjaeger.shinyapps.io/nhanesShinyBP/
This website provides context and documentation for our web application
Examples
Below are a few graphs produced by the platform. Additional graphs can be found by selecting the “Results” tab above. Instructions on how to generate statistics using the application are available by clicking on the “Get Started” tab.
Figure 1: Systolic blood pressure by age group in the last three NHANES cycles.
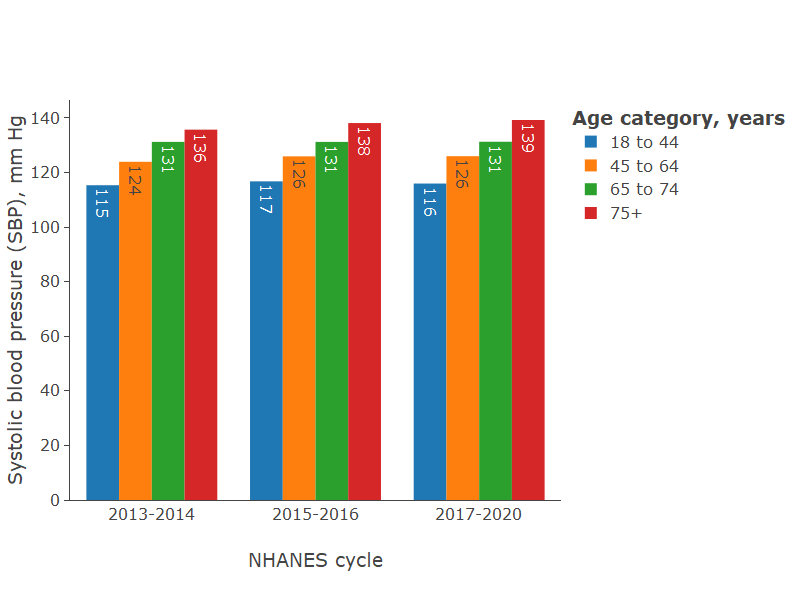
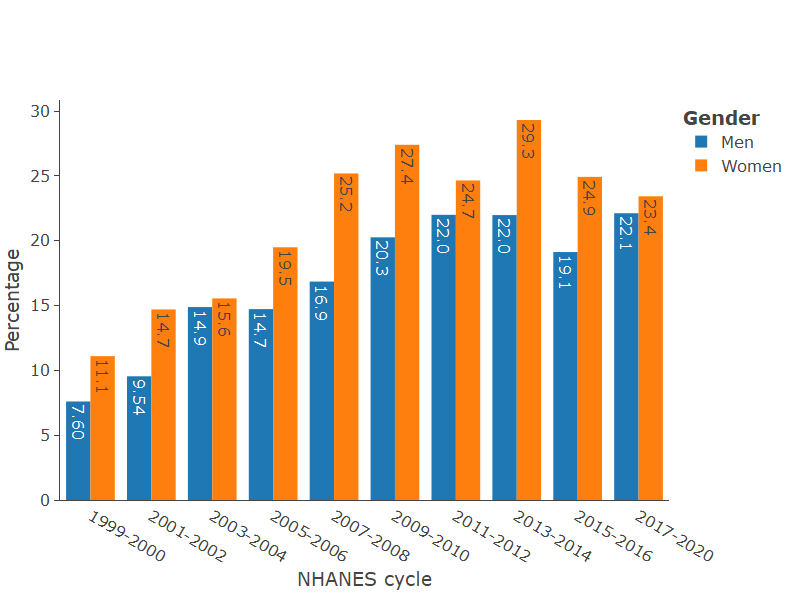
Figure 2: Prevalence of blood pressure control by sex among adults with hypertension.